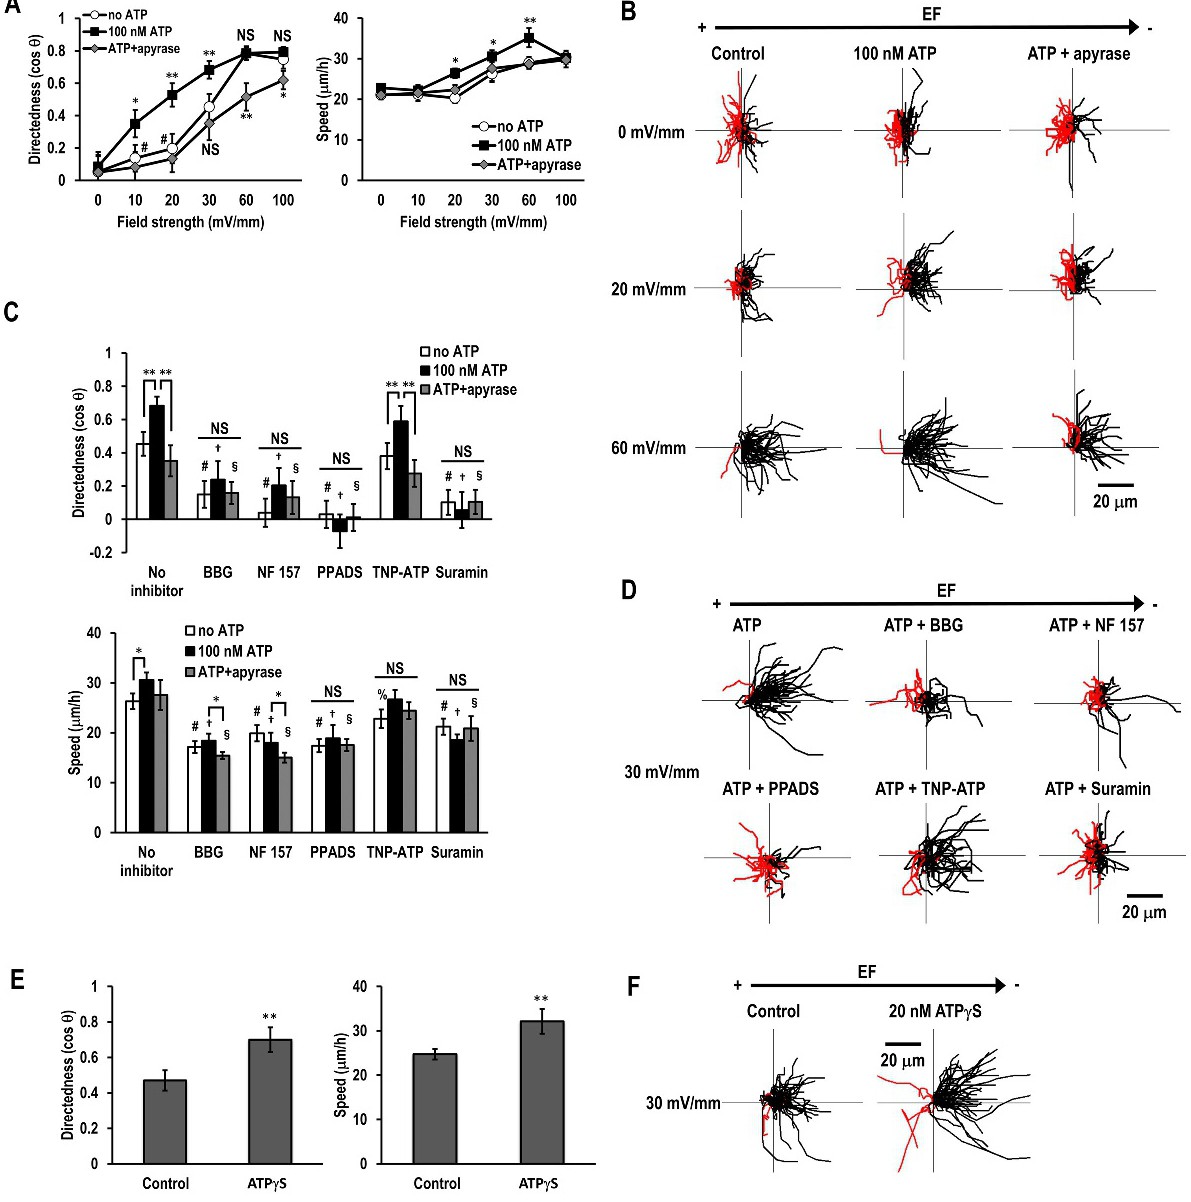
Fig. 1. Extracellular ATP sensitized galvanotaxis of hTCEpi cells via purinergic receptors. (A) Galvanotaxis was enhanced in the presence of 100 nM ATP. apyrase (10 U/ml) diminished the stimulatory effect of ATP. Data represented as mean ± SEM. *p<0.05, **p< 0.01 vs. no ATP. Note that there are no statistically significant differences between 0 mV/mm, 10 mV/mm, and 20 mV/mm of no ATP groups (#). (B) Migration trajectories in the presence or absence of ATP and apyrase. Black and red lines indicate trajectories of cells that migrated toward the cathode (right side) and the anode (left side), respectively. (C) Cells treated with inhibitors of purinergic receptors lost galvanotaxis (5 µM BBG, 3 µM NF 157, 30 µM PPADS, 10 µM TNP-ATP, or 100 µM suramin in the presence or absence of 100 nM ATP and 10 U/ml apyrase). EF=30 mV/mm. Data represented as mean ± SEM. *p<0.05, and **p< 0.01 between two groups indicated in the figure. #p<0.01 vs. no inhibitor no ATP group. †p<0.01 vs. no inhibitor 100 nM ATP group. §p<0.01 vs. no inhibitor ATP+apyrase group. %p<0.05 vs. no inhibitor no ATP group. (D) Migration trajectories in the presence or absence of inhibitors. (E) Non-hydrolyzable ATP analogue ATPµS (20 nM) enhanced galvanotaxis. EF=30 mV/mm EF. Data represented as mean ± SEM. **p< 0.01. (F) Migration trajectories in the presence or absence of ATPµS. n=40-50 for each group.